Webinar – Using Google Docs Spreadsheets to Track Investments
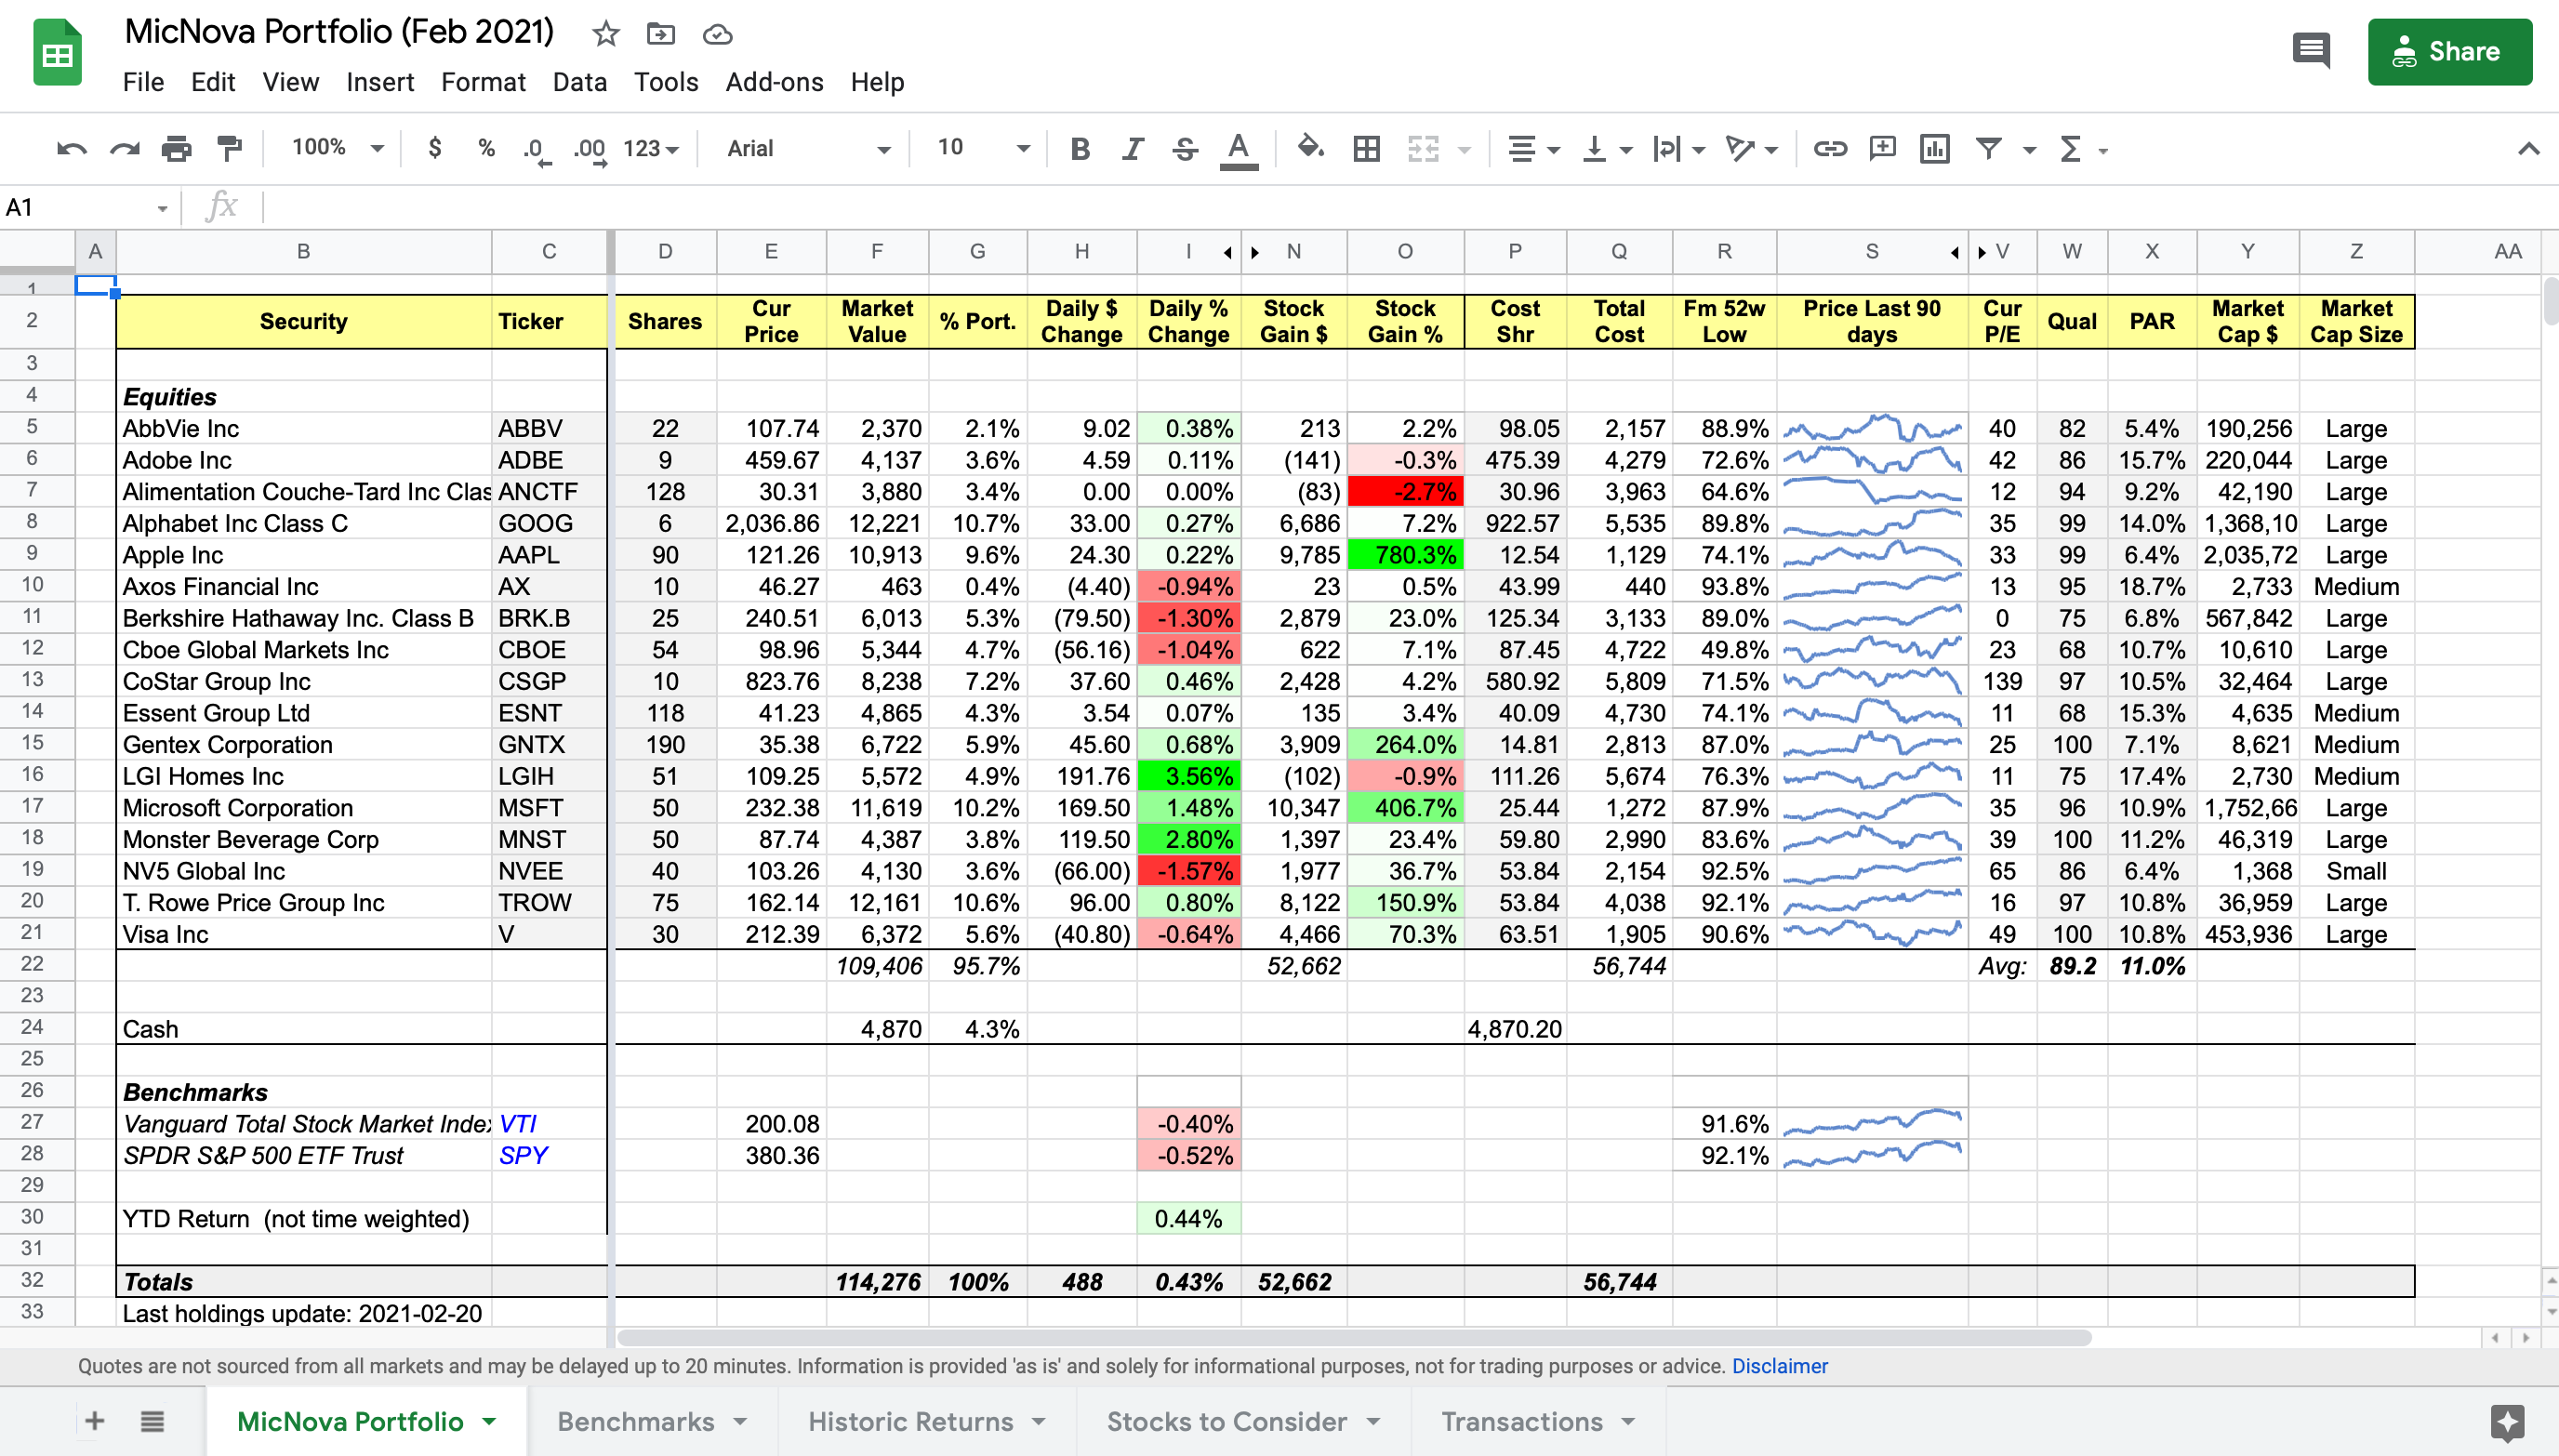
Google finance functions, which are part of Google Sheets, provide excellent tools to help you build custom spreadsheets to monitor your portfolio.
Our recent webinar explains how to use Google finance functions. It shows how to insert current and historic prices, get fundamental company data, use conditional formatting, make small graphs, and filter data in a Google sheet.
The presentation is about an hour long.
You can download the slides used in the presentation by clicking here.
